Monitoring Workloads
The cluster monitoring tools allow you to see Kubernetes metrics, such as pod metrics, node metrics and storage metrics for persistent volume claims. Kubernetes is the underlying container orchestration system that HEAT uses to deploy and scale it’s relevant service components, including ephermal processing workloads.
Understanding Pods
Pods are containerised workloads within HEAT, although HEAT surfaces all kubernetes resources including certificate managers, and system services for full visibility of what code is running within your HEAT environment.
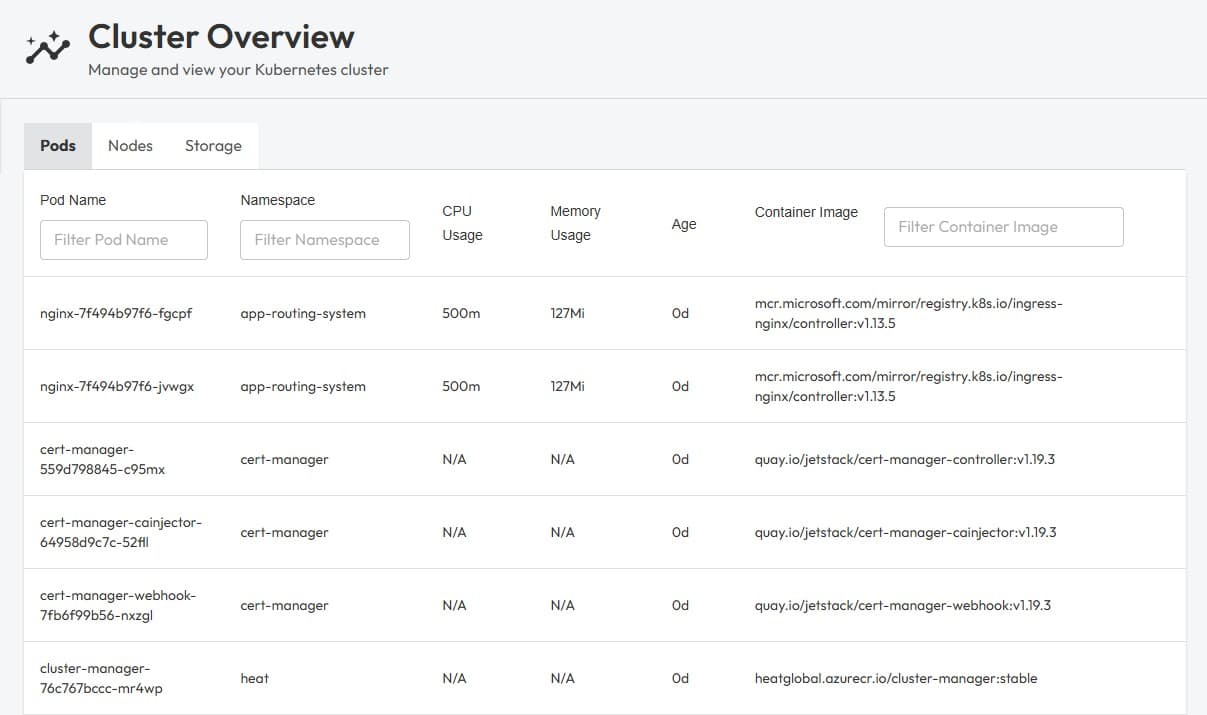
The container image is what represents the current version of code deployed for any given service. In the image above you can see within the heat namespace, a cluster-manager pod using the container image heatglobal.azurecr.io/cluster-manager:stable. This informs you that there is a service within the infrastructure running using code from our heatglobal.azurecr.io image repository, the official repository for VRAI production images.
This tool will surface assigned limits to CPU usage and memory usage, and not an active sample of current CPU/memory as this can fluctuate greatly. Some services have no limits defined, and may present as N/A.
This tool is useful for identifying what’s running in any given HEAT environment, and where the current version of that service is sourced from, via the container image. All services within the heat namespace are part of the HEAT product family.
Understanding Nodes
HEAT is designed to scale horizontally, which means additional systems can be added to extend HEAT’s overall processing capabilities. Each node is one such system, with our cloud based solutions using multiple smaller nodes to service a workable HEAT environment and scale on demand.
For on-premises scenarios, a typical setup may include just one node, or a singular ‘HEAT server’ instance.
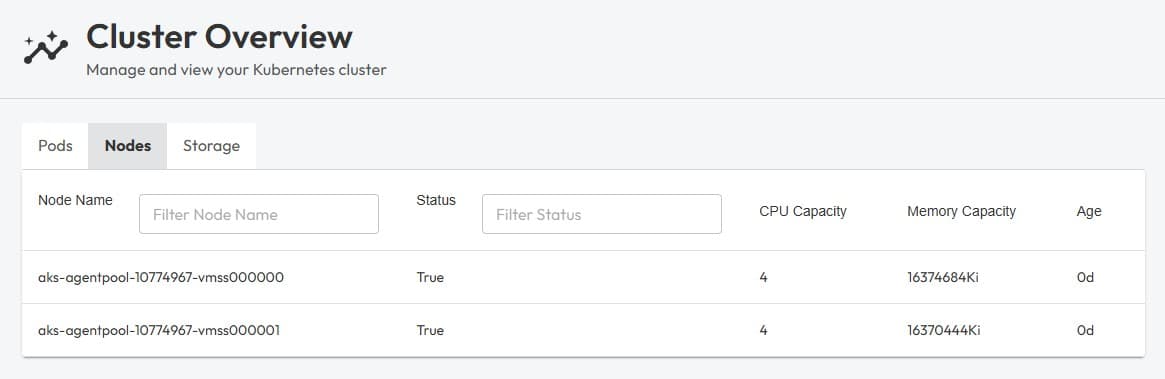
In the above example, you can see the HEAT environment we are browsing contains two nodes, each with 4 CPU cores and 16GiB of memory. When nodes are created, for example as part of AKS’s (Azure Kubernetes Service) autoscaling strategy, nodes will show up here representing the additional capacity, and may be removed when no longer required, for example when no sessions are actively processing.
Understanding Storage
Allocated storage within HEAT represents any persistent data volumes that are used by HEAT services. For example, when leveraging our out-of-the box HEAT Managed Object Store (powered by Minio), a sizable volume claim is created where the blob data actually lives.
The Monitoring overview shows internal blob store filesystem usage when available. Cluster Manager samples df on the MinIO /data volume about every 15 minutes. That figure reflects the built-in object store only, not external S3 or other databases.
When kubelet stats are available, the same overview also shows ingress throughput (rx + tx combined, in Mbps). Cluster Manager discovers ingress controller pods (Traefik, NGINX, or Azure App Routing), sums their network counters from each node’s kubelet stats/summary, diffs cumulative bytes between 15-minute probes, and reports the rate. This reflects HTTP(S) traffic entering and leaving the cluster via the ingress layer, not internal pod-to-pod traffic.
Service latency cards appear after the BFF collects at least 10 samples per target (about 20 seconds at the default 2-second interval). Cluster Manager probes Core API health, v2 API health, and a fixed 512 KiB sentinel object in the _recovery bucket on the HEAT Managed Object Store every 2 seconds, keeps the last 128 samples, and reports p95 latency in milliseconds. The sentinel object is created once if missing.
Each metric card on the Monitoring overview includes a sparkline for the selected history range (1h, 24h, or 7d). The BFF records samples every 60 seconds and stores up to 7 days on the cluster-manager scratch volume, so trends remain available even when nobody has the UI open. History includes platform data from Core API (session counts, projects, templates, node instances, node outputs, dimensions, and runner task counts). After a fresh deploy, charts fill in gradually.
The Cluster → Storage view still shows PVC allocation and bound status across all volumes.
The Runners view (GET /api/environment/runners, admin only) aggregates registered runner types with Kubernetes deployment scale, live pod CPU/memory (when metrics-server is available), current task backlog, 30-minute task throughput, and health warnings (OOM, crash loops, replica mismatch). Sparklines use GET /api/environment/runners/history?range=1h, sampled every 5 minutes with 1 hour retention.
It is up to the services to report their active storage use, so from the PVC view we can see the capacity that has been allocated and whether it’s in use (bound).
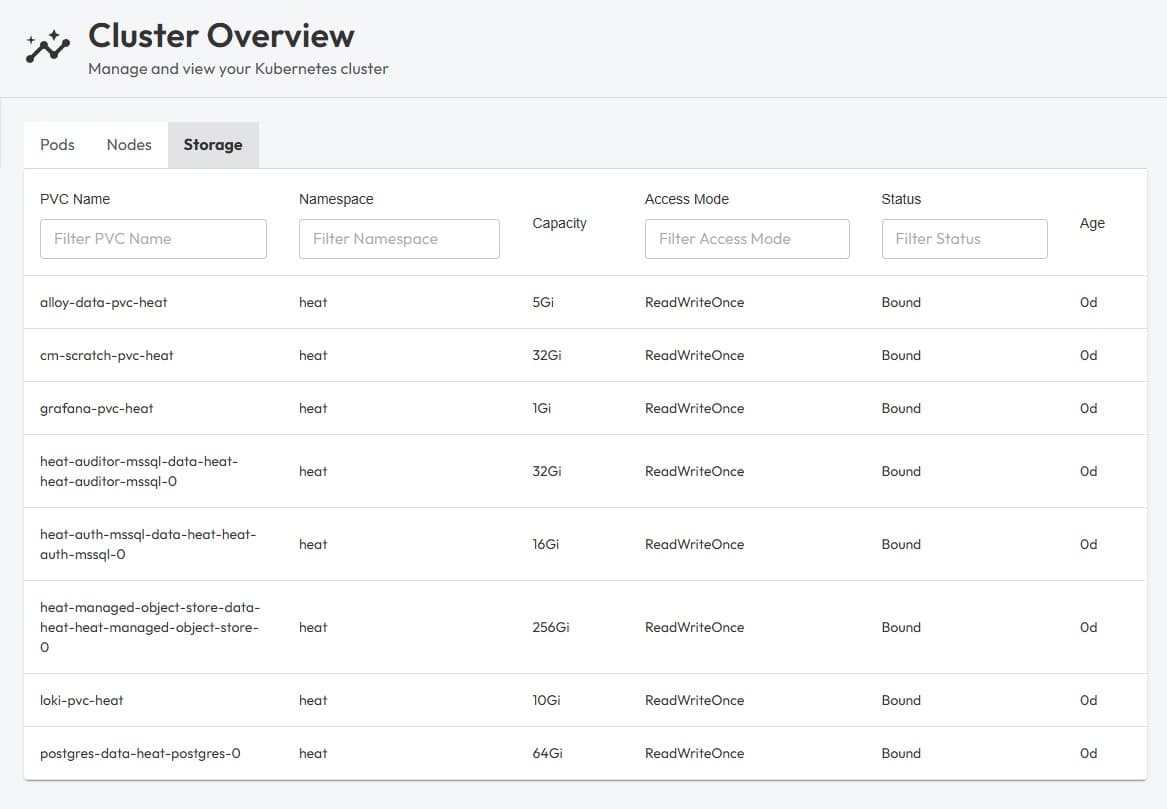
For reference, each storage volume is used for the following purposes:
| Volume | Description |
|---|---|
| alloy-data-pvc-heat | OpenTelemetry collector that handles logging |
| cm-scratch-pvc-heat | Cluster manager temp volume for release management and updates |
| grafana-pvc-heat | Dashboard engine for server-side logs & tracking workloads |
| heat-auditor-mssql-data-heat-heat-auditor-mssql-0 | Managed SQL database for auditing operations within HEAT |
| heat-auth-mssql-data-heat-heat-auth-mssql-0 | Managed SQL database for HEAT’s built in identity provider (user accounts, session tokens, PII) |
| heat-managed-object-store-data-heat-heat-managed-object-store-0 | Object storage for storing session data when using HEAT’s built in data source |
| loki-pvc-heat | Log aggregation storage for container outputs (capturing errors/runtime logs) |
| postgres-data-heat-postgres-0 | Managed SQL database for the core HEAT engine, such as session entities, templates, nodes etc… |
The requirements for the heat auditor and auth engines are relatively light and so they utilise the Express editions of MSSQL server.